What we will cover
In this course we explore a number of Linux command line tools (CLI):
- Bash scripting
- Several basic CLI commands (ls, cd, etc.)
- file manipulation oriented CLI commands such as head, cut, wc
- the awk programming language and scripting
We will apply these in a very concrete context: large matrix files that form part of various economic input-output models.
Pre-Requisites
Basic knowledge of and a working setup of a Linux or Linux-like development environment (including working with a shell and a text editor) is essential. Any standard Linux distribution should work (Using WSL on Windows machines) and MacOS as well (possibly with the installation of GNU tools).
Some exposure to scripting and any general purpose programming language (E.g., Python, Javascript, C++, Java) is required for understanding the scripts and work through the awk exercises.
The course derives motivation from the large matrix data processing task. Hence, some idea of what a matrix is and why it is relevant to know how to work with them is assumed, but it is not required for completing the course as we do now go into any mathematical aspects of matrices.
Table of Contents
Step 1
- Motivation for Command Line tools
- Overview and Setup of CLI Tools
- A hello world in Awk
Step 2
- Downloading Data: Using command line tools to get published matrix data stored in local disk
- Extracting Data: verify we have downloaded correct datasets and (if necessary) bring to a shape that makes it usable (e.g. uncompressing it)
Step 3
- Scanning Data Files: get a first high level view of what sort of files we have downloaded
- Figuring out Structure and Dimensions: understand structure of the file (separators, total number of rows and columns involved and their nature).
Step 4
- Scrubbing / Cutting / Reshaping: create clean files where matrix data with a known number of rows and columns are stored in tab separated ascii format.
- Transformations: Perform simple mathematical transformations and statistical operations. Investigate the degree to which matrix values are non-trivial (non-zero)
Course Content:
This course is an introduction to Tensor calculations with Eigen, a popular C++ library for working with numerical arrays and linear algebra. It covers the following topics:
- We learn the concept and techniques of the Eigen Tensor class
- How to declare, initialize Tensors of various ranks and types and how to access Tensor elements
- Elementary unary and binary operations involving Tensors
- More complex operations (reductions, contractions)
- Modifying the shape of Tensors
Who Is This Course For:
Developers in any Domain that need to use higher-dimensional numerical data containers
- Statistical Calculations
- Machine Learning
How Does The Course Help:
Eigen is a fairly large library. The course aims to:
- Introduce the Tensor part of the library and its purpose
- Sketch its overall structure and functionality
- Familiarize with the common usage patterns (API's)
What Will You Get From The Course:
- You will be able to confidently use Eigen::Tensor to solve common numerical processing tasks, in particular those requiring standard manipulation of tensors
- You will be able to contribute to the specific use cases mentioned above
Course Level and Difficulty Level:
This course is part of the Data Science family.
- This is a Core Level course in Data Science, which means that good grounding at Introductory level to various Data Science topics is a prerequisite for making the most out of this course.
- This is a Technical course which means certain mathematical (linear algebra) and/or technology elements (C++) are assumed as known before one can master the course material.
Advanced material not covered here:
- Memory layouts (how numerical data are stored in memory) and the performance implications
- Extending Eigen (in particular the C-API's)
- Numerical algebra / scientific computing concepts beyond what is needed to understand the core Eigen::Tensor functionality
If you have not taken an Open Risk Academy course before the "CrashCourse Academy Demo" provides a quick overview of the Academy.
The following table places the course in the Open Risk skills diagram:
Introductory Level | Core Level | Advanced Level | |
Non-technical | |||
Technical | DAT31071 |
Course Material:
The course material comprises the following:
- 14 interactive readings
- Embedded exercises based on the daily material
Time Requirements and Important Dates
- The course is self-paced and can be undertaken at any point. It requires a commitment of about one or two days total, depending on your familiarity with linear algebra and C++.
Where To Get Help:
If you get stuck on any issue with the course or the Academy:
- If the issue is related to the course topics / material, check in the first instance the Course Forum
- If the issue is related the operation of the Open Risk Academy check first the Academy FAQ. If the issue persists contact us at info@openrisk.eu
This course offers a brief introduction to the Copernicus Satellite Data Ecosystem.
Summary:
This course is a CrashProgram (short course) introducing the GeoJSON specification for the encoding of geospatial features. The course is at an introductory technical level. It requires some familiarity with data specifications such as JSON and a very basic knowledge of Python
Course Level and Type:
Introductory Level | Core Level | Advanced Level | |
Non-Technical | |||
Technical | CrashProgram DAT31053 |
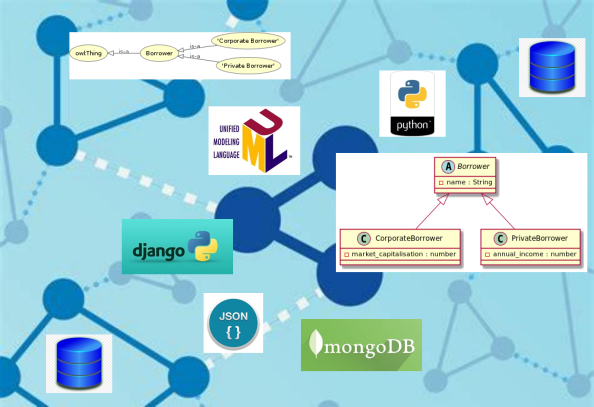
This course is a CrashProgram (short course) that explores how class inheritance of related data objects can be handled in a data science context. The course is at a core technical level. It requires some familiarity with database models, data specifications such as JSON and a basic knowledge of Python.
Course Level and Type:
Introductory Level | Core Level | Advanced Level | |
Non-Technical | |||
Technical | CrashProgram DAT31063 |
Summary:
An overview of graph methods in data sciences
Course Level and Type:
Introductory Level | Core Level | Advanced Level | |
Non-Technical | |||
Technical |
Summary:
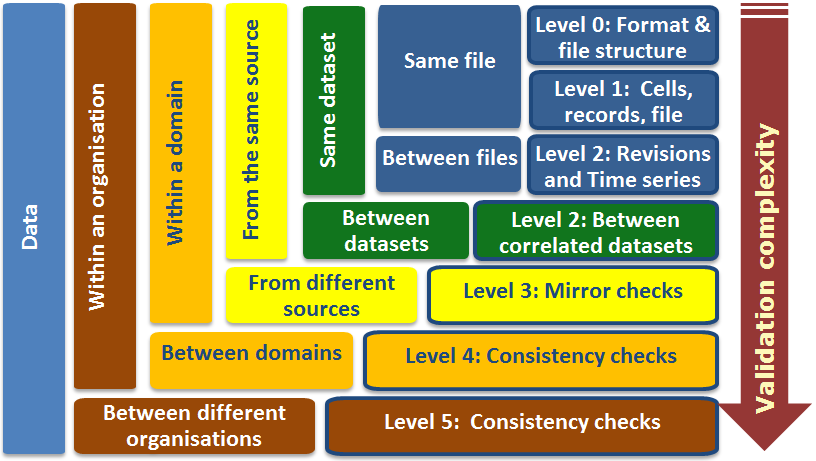
This course is a CrashProgram (short course) introducing the concept of a structured review of risk data. The course is at an introductory technical level. It requires some familiarity with credit risk data (and an ability to open and inspect data files) Step by step we build the knowledge required to review the suitability of data for a given purpose and how to report the findings
Outcomes:
- We learn the concept of Data Provenance
- We get a first exposure to the different levels of Data Validation as recommended by EuroStat
- We summarize our findings in a mock report written in Markdown format
Course Level and Type:
Introductory Level | Core Level | Advanced Level | |
Non-Technical | |||
Technical | CrashProgram DAT31046 |
Summary
Visualization of Timeseries Data
Course Level and Type:
Introductory Level | Core Level | Advanced Level | |
Non-Technical | |||
Technical | DAT31056 |
Summary:
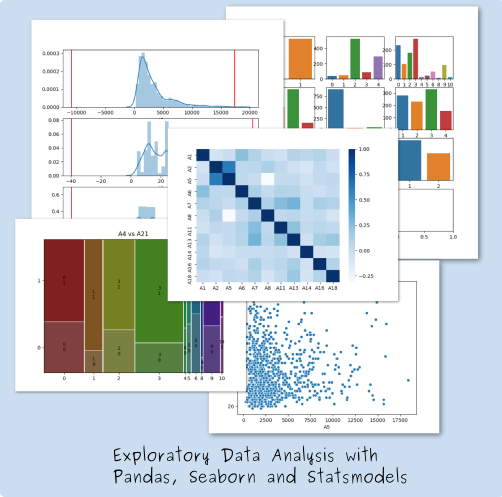
This course is a CrashProgram (short course) introducing exploratory data analysis. The course is at an introductory technical level. It requires some familiarity with credit risk data (and an ability to open and inspect data files). Step by step we build the knowledge required to perform a comprehensive exploratory data analysis
Prerequisites:
The course can be pursued on a standalone basis. It is advisable to pursue the course after DAT31046 (Risk Data Review) which discusses a review of the data from a data quality validation perspective.
Outcomes:
- We learn the concept and techniques of Exploratory Data Analysis
- Touch upon the issue of bias and how to mitigate it
- Learn about more advanced formats such as HDF
- Basic exploratory analysis using pandas
- Easy visual analysis of association using seaborn
- Contingency tables, WoE and Information Value using pandas, scipy and statsmodels
- We summarize our findings in terms of numerical and graphical results in a mock report written in Markdown format
Course Level and Type:
Introductory Level | Core Level | Advanced Level | |
Non-Technical | |||
Technical | CrashProgram DAT31048 |