• Welcome to the Open Risk Academy

    Here we forge the open source future of risk management!

    The Academy offers a unique range of online eLearning resources spanning and integrating the range of Data Science, Sustainability and Risk Management

    Courses are split into technical (involving mathematics or programming) and non-technical.

    Search for a topic of interest or simply scroll down the page to find an interesting course!

    Access to the courses is free but you must request an account along with your motivation.

    If you find our public and free resources useful consider donating to support their ongoing maintainance and development


Courses


Academy News

Category split of Data Science for better usability.

by Ad Min -

The Data Science category of courses at the Academy has been growing, covering a wide range of current topics relevant for modern quantitative risk management and sustainable finance. In order to organize the content into more homogeneous sets we have now split this category into two sub-categories: Data Engineering and Data Science "proper".

While the precise boundary between these two categories may be a matter of semantics, there is clearly a more technology oriented side of Data Science that focuses on the underlying data flow and processing mechanisms, the API's, programming languages, diverse data formats and related issues, versus the information extraction part that assumes and builds on top of the engineering part.

The existing group of courses has thus been shifted into the corresponding sub-categories and future courses will appear under their respective buckets. The new categorization is of course available at the front page of the Academy. Alternatively you can also peruse the descriptions at our website.

Enjoy!

Testing the Open Risk Manual Android app

by Ad Min -

Dear Academy users,

as part of our plan to make the Open Risk Manual as widely accessible and usable as possible, we are deploying and Android app version. If you are interestested in this functionality you can try out the app during the open testing period.

You can join the testing via a web link

or directly from the Google Play App Store


Please try it out and let us know how it went!

New Course: Visualization of Time Series Data

by Ad Min -

A new course in the data science category offers a deep-dive into the structure of visualizations, in particular visualizations of timeseries data.

The course is now live here at the Academy


Pre-requisites and target audience

Knowledge of basic visualization techniques and mathematical notation of functions and maps. Familiarity with data series and their usage in data science. Should be useful for people who need to work with visualizations e.g., in the context of exploratory data analysis and who want to deepen their intuition about how visualizations are put together.

All visualizations are produced using open source Python or Javascript libraries but this is not a course about programming visualizations!


Summary of the Course

What we aim to achieve in this course is to deconstruct how both typical and less common visualizations of timeseries work.

In the first instance we decompose the visualization process into:

  • A mathematical transformation, which (optionally) may operate on the raw data and produce new representations thereof
  • A visual transformation, which converts quantitative data into a visual space

We apply this "recipe" to a large number of visualizations (21 in total), using always the same simple data series. The result is an exploration of the many diverse ways visualization can help extract meaning from data. The steps of course:

21 ways to visualize a simple timeseries


  1. A Numerical Table is also a Visualization
  2. Visualizing Observation Times
  3. Visualizing Observation Values
  4. Color Plots of Measurement Values
  5. Bubble Plots of Measurement Values
  6. Scatter Plots and their Limitations
  7. Linear Line Plot and Continuity
  8. The Step Plot and Discreteness
  9. The Smooth Plot: Pleasant but with a stinging tail
  10. The Area Chart: Filling up space to our advantage
  11. New Visualization Horizons with the Horizon Chart
  12. Abusing the Bar Chart Concept
  13. A Sorted Bar Chart and the power of mathematical transformations
  14. 14. The Histogram Transformation
  15. The (Probability) Density Plot and Mathematical Models
  16. The Lag Plot and Persistence
  17. Autocorrelation and further Arcana
  18. The Phase Diagram and Dynamical Systems
  19. Displaying data in the Frequency domain
  20. A Calendar is also a Visualization
  21. The Plot Thickens: The Weekly Calendar Version
Enjoy!

New courses in Data Science, Sustainable Finance and Credit Portfolio Management categories

by Ad Min -

The following three courses have been activated in the Open Risk Academy and are open to all registered users:

1. Input-Output Models as Graph Networks

Course Link


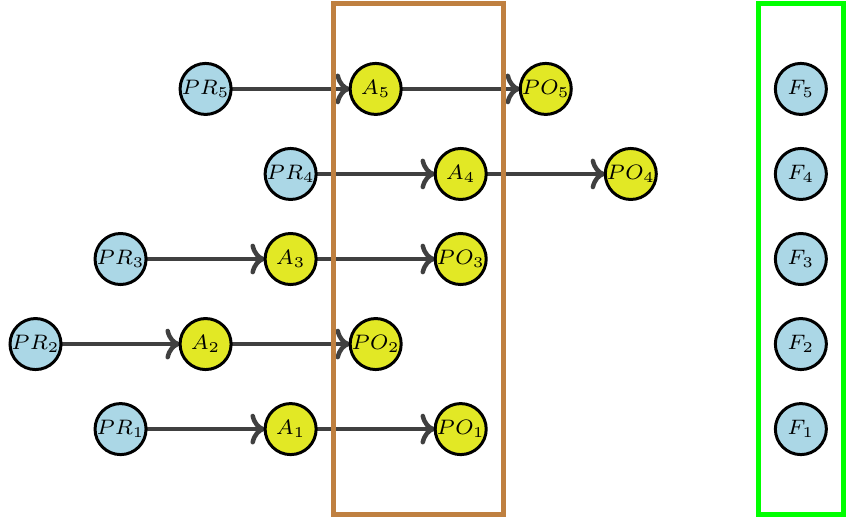
Economic Input-Output models find various applications in Sustainable Finance. They are typically expressed in term of matrices and vectors but a certain type of qualitative analysis shows strong affinity with graph theory. In this course we go over the relevant concepts and linkage between these two domains.

Summary of the Course
  • Step 1. In this step we discuss in more detail the motivation for the course and provide a very brief introduction to the graph theory to establish the notation.
  • Step 2. In this step we explore the duality between graphs and matrix representations.
  • Step 3. This step introduces the concept of Qualitative Input-Output Analysis
  • Step 4. In the fourth step off the course we discuss special kinds of nodes: Sources, Sinks and Conservation Laws
  • Step 5.In the final step of the course we discuss and interpret in graph terms the typical question one wants to answer with an IO model: what happens if there is new set of final demands?

2. Mathematical Representations of Credit Portfolio Data

Course Link


For our purposes in this course Credit Data is any well-defined dataset that has direct applications in the assessment of the Credit Risk of an individual or an organization. More generally, it is any dataset that allows the application of data-driven Credit Portfolio Management policies. Digging into the meaning of these data collections, the logic that binds them together, is essential for understanding what they can be used for and what limitations and issues they may be affected by. This course explores new angles to look at old practices.

Summary of the Course
  • Step 1. Definition of Credit Data
  • Step 2. Credit Data Classifications
  • Step 3. From Graphs to Reference Data
  • Step 4. Static Credit Data Snapshots
  • Step 5. Dynamic (Performance) Credit Data
  • Step 6. Scheduled versus Actual Cash Flows

3. An overview of graph methods in data science

Course Link

Graphs (and the related concept of Networks) have emerged from a relative mathematical and physics niche to an ubiquitous model for describing and interpreting various phenomena in very diverse domains. In fact the term graph appears now is so many different context it is hard to keep track of the meaning and relations between all these applications. In this course we aim to explore relations between different graph concepts as they are currently used in data science and related fields.

Summary of the Course
  • Step 1. Introduction
  • Step 2. The Graph of a Function
  • Step 3. The Mathematical Graph
  • Step 4. The Abstract Data Type (ADT) Graph
  • Step 5. Computation Graphs
  • Step 6. Data Graphs
  • Step 7. Property Graphs
  • Step 8. Knowledge Graphs
  • Step 9. Graph Databases
  • Step 10. Probabilistic Graph Models
  • Step 11. Graph Neural Networks (GNN)

Enjoy!

New Course: Working with Large Matrices using Command Line Tools

by Ad Min -


Dear Academy users,

we are happy to release a fresh new courseWorking with Large Matrices using Command Line Tools

What is this course about

In this course we explore a number of Linux command line tools (CLI):

  • Bash scripting
  • Several basic CLI commands (ls, cd, etc.)
  • File manipulation oriented CLI commands such as head, cut, wc
  • The awk programming language and scripting

We apply these in a very concrete context: working with large matrix files that form part of various economic input-output models. Such files are cumbersome to work with in spreadsheets, but on the other hand the overhead of using a full-blown statistical / data science environment might be also high. Command line tools offer a handy intermediate approach that may be useful in various context.

Prerequisites

Basic knowledge of and a working setup of a Linux or Linux-like development environment (including working with a shell and a text editor) is essential. Any standard Linux distribution should work (Using WSL on Windows machines) and MacOS as well (possibly with the installation of GNU tools). 

Some exposure to scripting and any general purpose programming language (E.g., Python, Javascript, C++, Java) is required for understanding the scripts and work through the awk exercises.

The course derives motivation from the large matrix data processing task. Hence, some idea of what a matrix is and why it is relevant to know how to work with them is assumed, but it is not required for completing the course as we do now go into any mathematical aspects of matrices.

Table of Contents

  • Motivation for Command Line tools
  • Overview and Setup of CLI Tools
  • A hello world in Awk
  • Downloading Data: Using command line tools to get published matrix data stored in local disk
  • Extracting Data: verify we have downloaded correct datasets and (if necessary) bring to a shape that makes it usable (e.g. uncompressing it)
  • Scanning Data Files: get a first high level view of what sort of files we have downloaded
  • Figuring out Structure and Dimensions: understand structure of the file (separators, total number of rows and columns involved and their nature).
  • Scrubbing / Cutting / Reshaping: create clean files where matrix data with a known number of rows and columns are stored in tab separated ascii format.
  • Transformations: Perform simple mathematical transformations and statistical operations. Investigate the degree to which matrix values are non-trivial (non-zero) 

Resources

We will work with Input-Output matrices downloaded from well known public distributions (EXIOBASE, FIGARO, OECD-ICIO). Scripts providing guidance and solutions to the suggested exercises are available the Open Risk Academy Gitub Repositories.

Enjoy!


New Course: An Introduction to the Copernicus Satellite Data Ecosystem

by Ad Min -
Earth Day is an annual event on April 22 to demonstrate support for environmental protection. First held on April 22, 1970, Earth Day celebrations now include a wide range of events coordinated globally by earthday.org (formerly Earth Day Network) including 1 billion people in more than 193 countries.

We honor this occasion releasing a new Academy data science course that provides an introduction to the Copernicus Satellite Data Ecosystem.  Copernicus is the name of an Earth observation system of the European Union's Space programme. Its objective is to look at our planet and its environment, in particular serving the needs of European citizens. Copernicus offers integrated information services (data) that draw both from Satellite based Earth Observations and In-Situ (non-space) data collection.

Picture of a sentinel satellite

This course should be a useful first reading for anybody who wants to get involved in using Copernicus data but has no prior experience.

In the first step we go over a high-level overview of the Copernicus program. This should serve as a first orientation for anybody interested to work with Copernicus data but is not yet sure what is available.

In the second step we build a high level catalog of the available data resources. Copernicus is a large program, involving many institutions, diverse satellites and instruments, providing original and processed data, including additional sources of ancillary data and an ever evolving set of tools providing data access. This section aims to organize all these to some degree.

In the third step and final step of this introduction into the Copernicus programme we discuss some tools that relevant for working with Copernicus data resources. Detailed work with Copernicus data requires using diverse specialized tools but there are ongoing efforts to systematize and standardize them with various toolboxes, platforms and API's. Here we only scratch the surface of the relevant technologies to get you started!

Enjoy, and as always keep us posted with any feedback, ideas or suggestions about how to improve the Open Risk Academy.
Older topics...