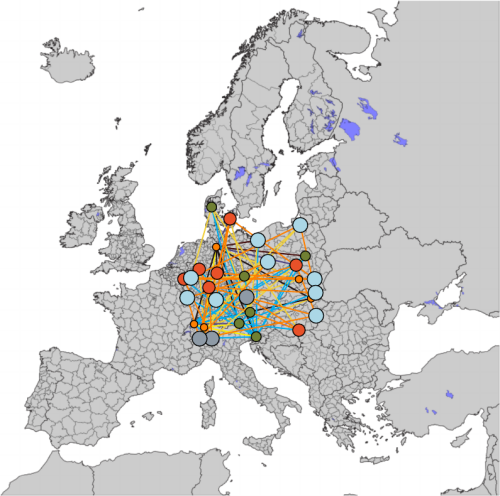
In this second Open Risk White Paper on Connecting the Dots we
examine various measures of concentration, diversity, inequality and sparsity in
the context of economic systems represented as network (graph)
structures.
We adopt a stylized description of economies as property
graphs and illustrate how relevant concepts can represented in this
language. We explore in some detail data types representing economic
network data and their statistical nature which is critical in their use
in concentration analysis.
We proceed to recast various known indexes drawn from distinct disciplines in a unified computational context.
