Adressing sustainability is a major challenge (and opportunity) facing portfolio managers in diverse domains. If sound financial portfolio (and risk) management was not already enough of a challenge, integrating totally new and diverse data streams about environmental impacts, new objective functions that go beyond monetary measures, new and evolving environmental policies and targets is a major journey that has barely begun.
Some Academy users might be already familiar with equinox, our open source sustainable portfolio management platform. In a new series of blog posts we explored how it can be used to support sustainable procurement management. In procurement, the financial portfolio is a collection of contracts where the counterparties are various suppliers of goods, works or services.
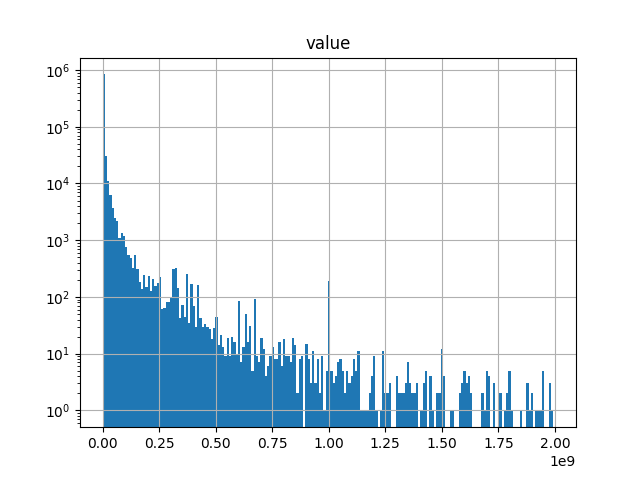
The use case is built around the TED, an Open Data database In the European Union that is the pre-eminent platform collecting data about public procurement. In the first post we explore the overall shape of the dataset which is quite large (over three millions of contracts between 2017-2021)!

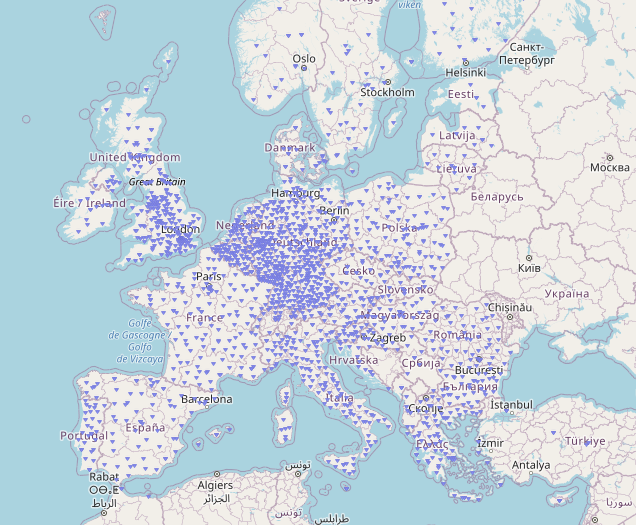
In the second post we dig deeper into important facets of the data, with the aim of constructing a meaningful economic representation of the public procurement process. Most importantly this involves identifying who is the procurement manager and who are their counterparties. The geographic distribution of contracting entities cover the entire European region (every NUTS3 region)

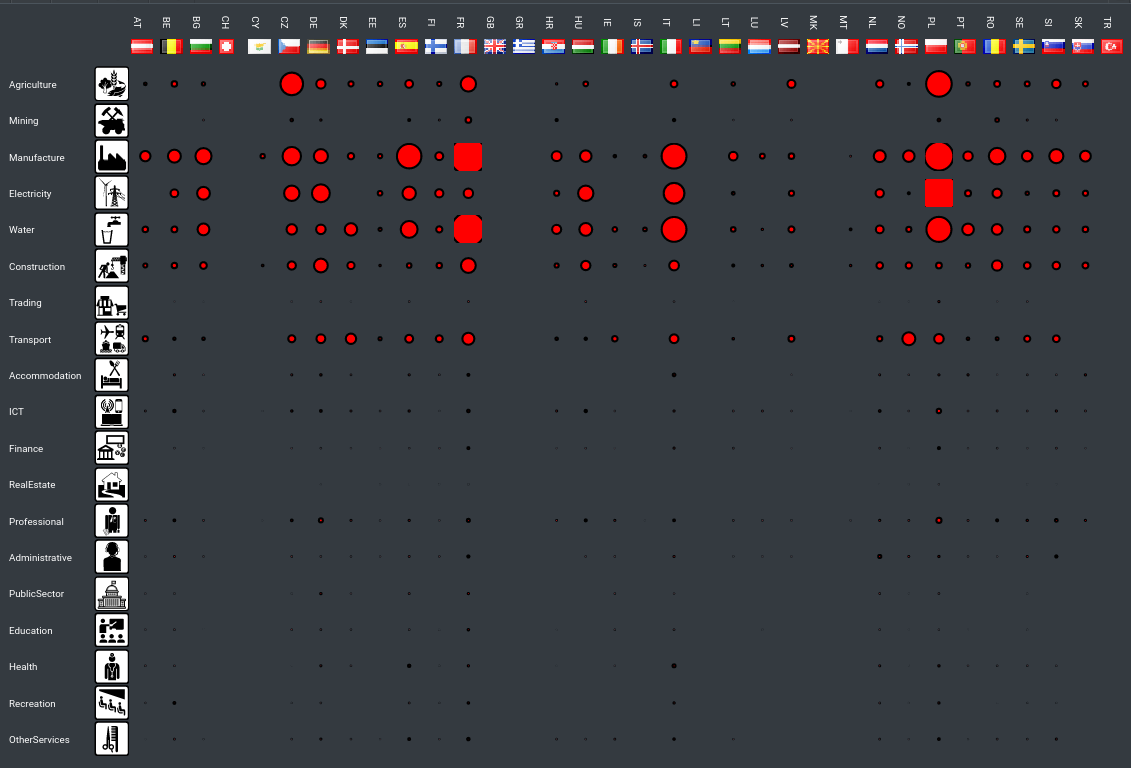
In the third part of this series we illustrate how one may assign greenhouse gas emissions (GHG) to public procurement using environmentally extended input-output models. Public procurement represents final demand of the public sector (which ultimately provides services to households). Towards that end we adopt datasets produced by Eurostat as the basis for the GHG attribution. Specifically, Eurostat produces the statistics with a production and consumption perspective and re-publishes the territorial statistics of the European Environmental Agency (EEA). For this exercise we utilized emissions intensity estimates. As outcome we can generate a variety of reports and visualizations, such as a sector-by-country grid of attributed emissions:

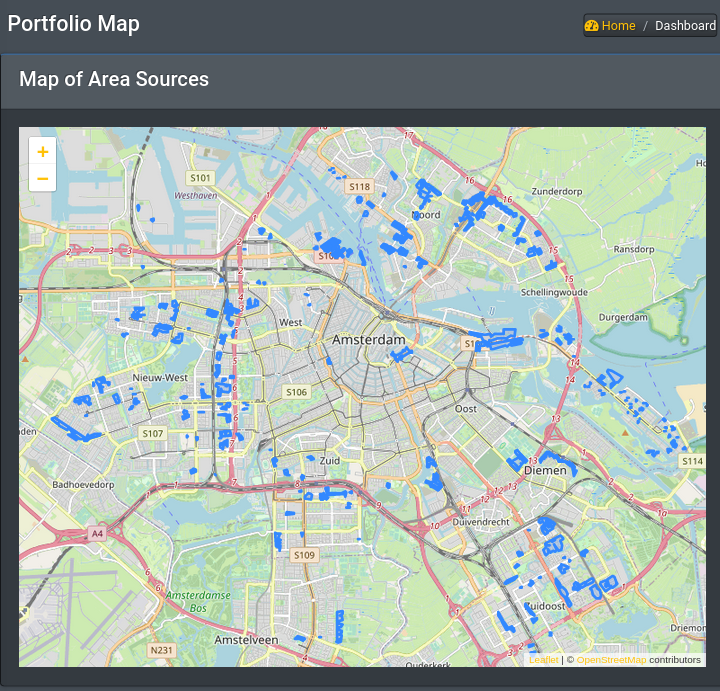
Finally, we conclude the discussion with an overview of the conceptual data models involved and future applications that may involve additional geospatial data linked to emissions sources.
Enjoy!
